
Agritech · ITEX AgroAI®
The power of AI integration in viticulture.
We don’t just provide technology — we connect it all together. Customized AI, adapted to each vineyard’s specific conditions, proven in the field.
Why it matters
Why AI integration matters
Maximize what you have
Get more value from the tools and devices already in the vineyard.
Smarter decisions
Data-driven calls across the vineyard — not calendar guesswork.
Less complexity
Reduce operational complexity and manual effort across the season.
How it works
Your vineyard’s digital assistant
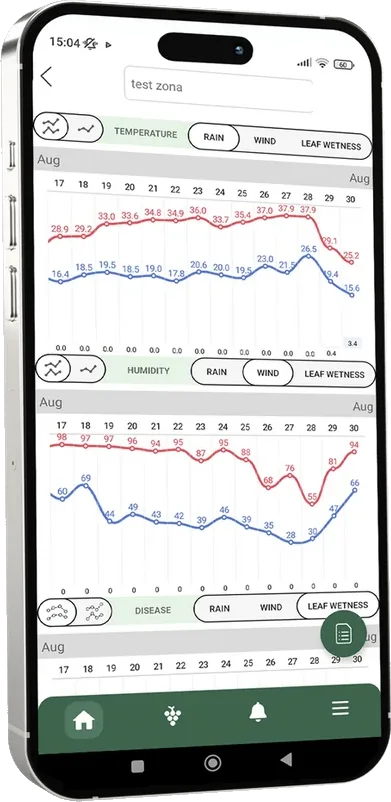
Continuous, multi-point in-canopy sensing reads the microclimate vine by vine — temperature, humidity, wind, rainfall and leaf wetness — and turns it into decisions.
See
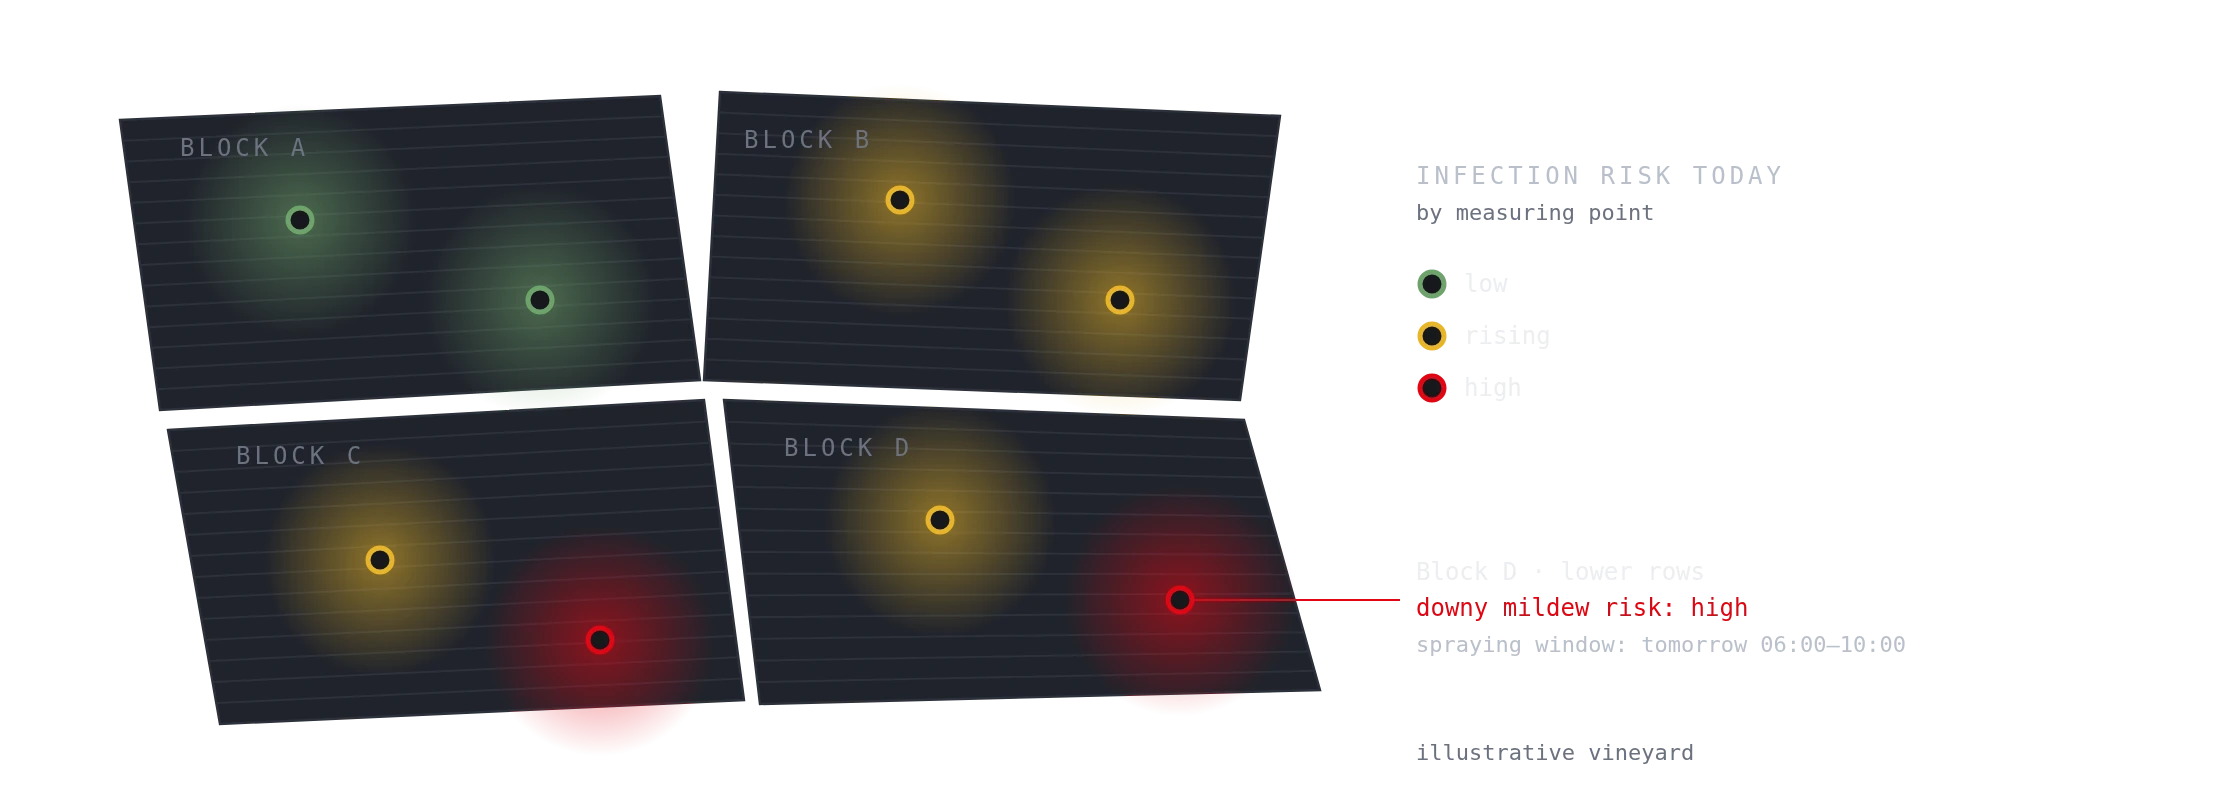
Disease-pressure mapping shows exactly which part of the vineyard is at risk — and where frost or rainfall hit, and when.
Predict
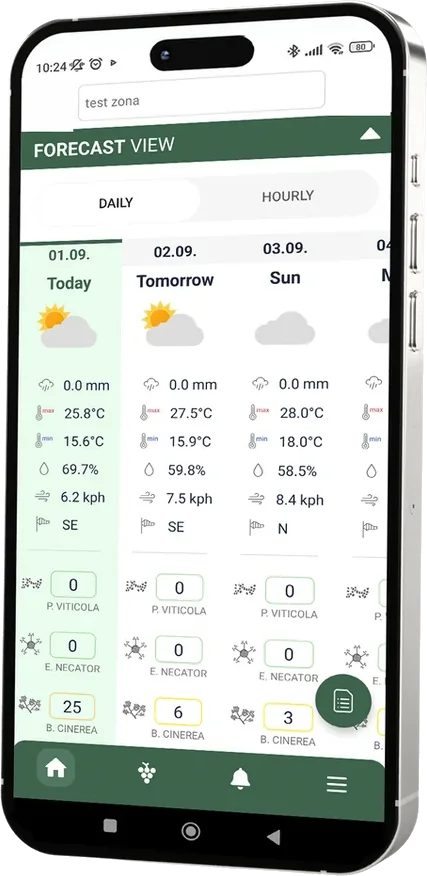
Get a heads-up before budburst, veraison or frost, with spraying windows timed to the forecast from the vine’s point of view.
Act
Plan visits where they’re needed, spray only when it counts, and cut unnecessary treatments — protecting yield and quality.
What you get
Everything the vineyard tells you, in one app
Growth stages
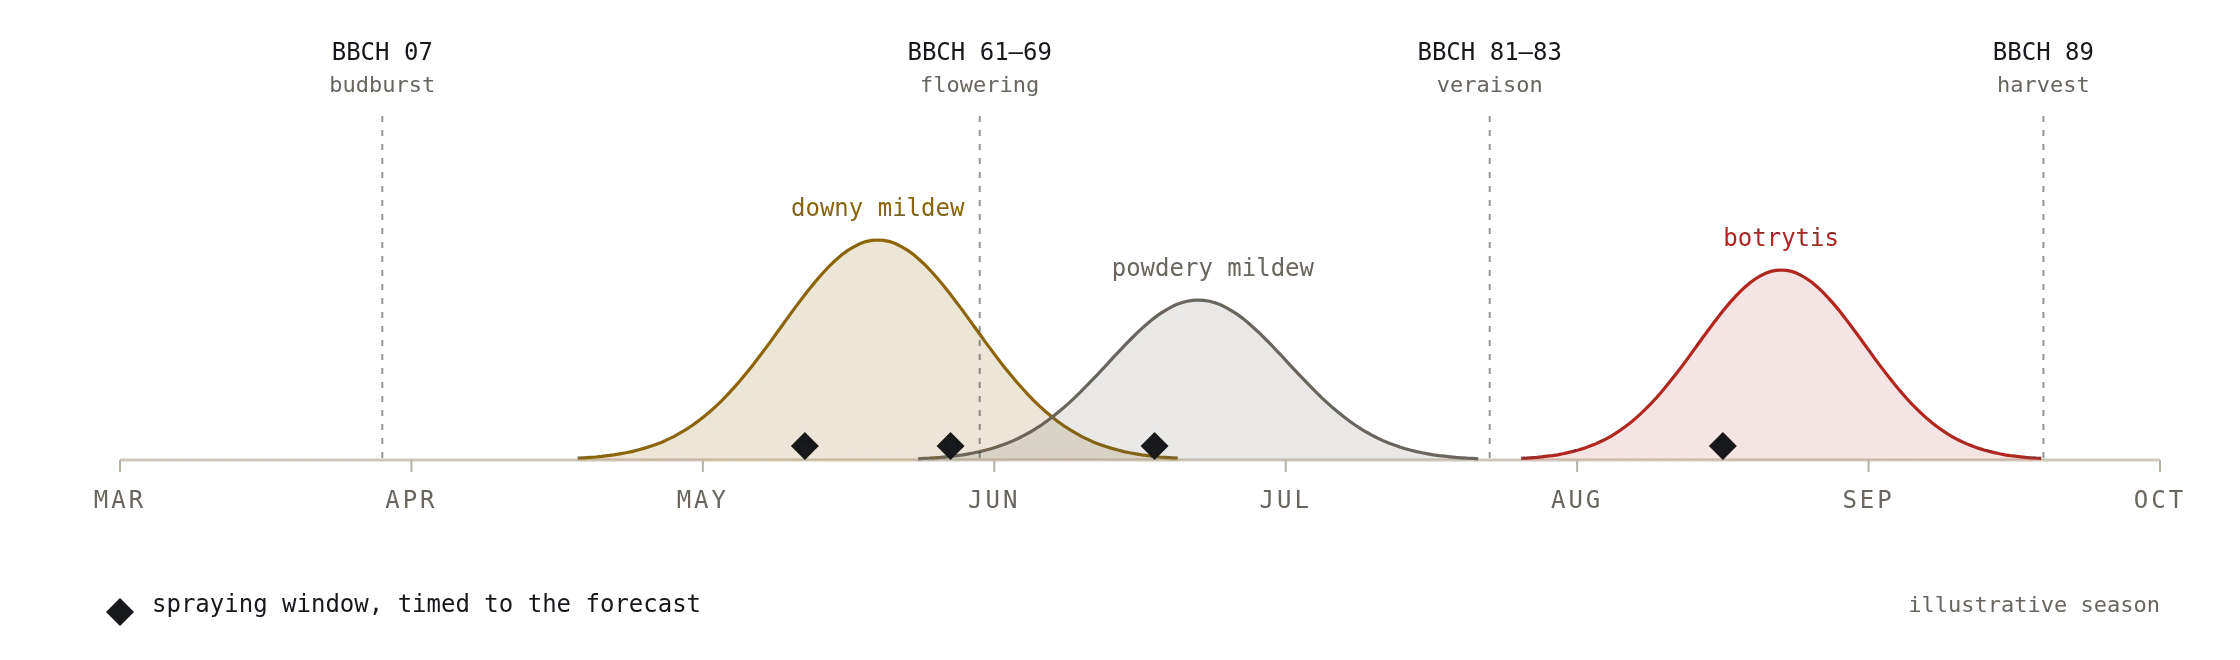
Plant-growth models tuned to your variety, and in some cases the clone, give you a heads-up before each BBCH stage — budburst, flowering, veraison.
Infection risk
Risk levels for the five main pathogens — downy and powdery mildew, botrytis, black rot and Phomopsis — for every measuring point, with an alert when they rise.
Spraying windows
Disease pressure for the coming days, spraying conditions and your current protection level, daily and hourly, worked out from the forecast.
Field book
Log every visit and treatment in the app. Protection is recalculated as you go, and the season’s field book assembles itself — traceability for every block.
Season reports
An annual report arrives on its own, together with a side-by-side comparison of two consecutive seasons.
Maps and history
Current readings, forecast, history, heat maps and field notes, on iOS and Android.
In the vineyard
Sensors where the microclimate changes
The network follows your terrain — the ridge, the hollow, the edge by the woods — with as many measuring points as the vineyard needs.
Solar-powered
Each sensor runs on its own solar panel and mounts on a trellis pole. No cables and no power needed in the field.
Always connected
Readings travel over the mobile network, and each sensor picks the strongest operator by itself.
Almost no upkeep
One visual check a year. If the panel gets dusty, wipe it with a damp cloth.
Proven in the field
300+ hectares under management
20–30%
less pesticide use
70–100h
labor saved per hectare / year
10–20%
less fertilizer, from real-time soil data
Get started
Bring AgroAI to your vineyard.
Tell us about your vineyard and we’ll map the fastest path to measurable results.